A test fails in CI. You open the report. It says: failed.
That's it. That's all you have.
It tells you the test name. It tells you the assertion that failed. It tells you the line number. It tells you nothing about what the UI was actually doing. No recording. No console output. No network trace. The report is a box score for a game nobody filmed — you know who lost, you have no idea why.
So you do what every engineer on every team does in this situation: you re-run it locally and hope you can reproduce the failure. Sometimes it passes on the first try. If it was a race condition, a flaky animation state, a timing window that doesn't reproduce on your machine, you're debugging a ghost — you open Slack, ask if anyone else saw it, and file it as "intermittent" until it starts failing consistently enough to force action.
That cycle — fail in CI, pass locally, debug nothing, repeat — had been draining time from the UI team at Capillary for a long time. Nobody had formally defined it as a problem worth solving. It was just the way automated testing worked.
I decided to define it. Then build a fix.
The gap no one had named
WDIO (WebdriverIO) is the test framework for our UI. It runs a suite of functional automation tests and generates an HTML report after each run: which tests passed, which failed, how long they took. Pass or fail, at the assertion level. The test either got the expected output or it didn't.
What it doesn't capture is everything that happened between the start of the test and the assertion:
- No recording of DOM state or user interactions
- No captured console errors from the browser
- No HTTP call trace
- No way to tell a code bug from a flaky test without reproducing it locally
This gap exists because it's not what test frameworks are built for. WDIO, Playwright, Cypress — they're assertion engines, not observability tools. The failure tells you where the code disagreed with the expectation. The report doesn't tell you what the application was doing when it disagreed.
The result is that every failed automation test triggers an investigation rather than a diagnosis. You're not debugging with evidence; you're reconstructing a scenario from memory and hope. About 60% confidence, by the data — which means 40% of the time you're fixing the wrong thing.
This isn't a new problem. It's existed since we started writing automation tests. But nobody had written it down as a problem statement, which meant nobody was building toward solving it.
What the gap was costing
No single instance of this is expensive. The aggregate is.
Across the org, this cycle was costing roughly $2.88M a year in direct engineering time. The breakdown:
- 4–6 hours per failure on average to investigate
- 40% of fix attempts failing because they were based on hunches rather than evidence
- 35% of failures requiring multiple engineers
Nobody had written a ticket for this. It wasn't in anyone's sprint. It was just the cost of doing automation the normal way — distributed across dozens of engineers, no single instance expensive enough to force a decision.
I decided to stop paying it.
The constraints
Before building anything, the box it had to fit in:
- The UI tests run on WDIO — migrating to Playwright wasn't in scope.
- USCRM runs on a local internal grid with no external egress — any cloud-based service was ruled out.
- Adding an SDK to the application under test was off the table — test infrastructure belongs in the test layer, not the app.
So any solution had to work offline, require no changes to application code, leave no external dependencies, and generate a single self-contained artifact that anyone on the team could open and immediately use.
The requirement I kept coming back to: whatever this produces needs to be in the report. Not linked from the report. Not generated alongside it. Embedded. When an engineer opens the test results, the session replay, the console output, and the network log have to be right there, under the failed test. Zero additional tooling, zero additional URLs.
What I didn't want to build
The obvious candidates already exist — and each one missed at least one constraint.
Visual regression tools (Percy, pixelmatch) do screenshot comparison between builds. That's a different problem: it tells you the UI looks different across versions, not what was happening when a specific test failed. A regression-detection tool, not a debugging tool — and it requires running two versions of the app.
Log aggregation (Datadog, Elastic) captures server-side and application logs. It doesn't capture what the browser was rendering or the DOM state at the moment of failure, and it requires infrastructure that isn't embedded in a test report.
OS-level screen recording gives you video, but video files are large, unindexed, and unembeddable. You'd need a separate viewer, a storage backend, and a way to correlate the recording with the specific failure.
Playwright's built-in tracing — video, snapshots, network logs — is genuinely good. But we're on WDIO, not Playwright.
BrowserStack and LambdaTest both offer session replay for tests run through their grids. No external egress meant those services had no access to ours.
Sentry Session Replay was the closest analog — but it requires an SDK initialized inside the application under test (test infrastructure leaking into app code), plus a live external service call during CI.
The pattern I needed — embedded in the report, offline-capable, triggered automatically on failure, zero external dependencies, no changes to the app under test — didn't exist as a packaged solution. That constraint ruled out most of the existing ecosystem.
Choosing the recording library
The right tool for browser-level session recording is rrweb — open source, used in production by multiple observability and session-replay products. It works differently from screen capture: instead of capturing pixels, it captures DOM mutations — every change to document structure, CSS, attributes, text content — serializes them as events, and a player library reconstructs and replays the page state from those events, frame by frame, without the original application running.
That distinction matters for the embedding requirement. An MP4 file is 50–200 MB. A DOM event log for a 60-second test run is a few hundred KB of JSON. You can inline JSON into an HTML file. You can't inline a video.
The first decision: don't add rrweb to package.json.
This seems counterintuitive — managing dependencies is supposed to be the responsible path. But CapVision ships inside @capillarytech/cap-ui-dev-tools, an internal shared package consumed by multiple teams across the Engage platform. Adding rrweb as a declared dependency means every consumer inherits the version, the potential conflicts, and the update cycle.
Instead, I vendored the pre-built bundles as static assets:
| File | Size | Purpose |
|---|---|---|
| capvision.min.js | 137 KB | rrweb recording library |
| capvision-player.min.js | 112 KB | rrweb replay library |
| console-record.min.js | 124 KB | rrweb console plugin |
| console-replay.min.js | 108 KB | rrweb console replay plugin |
~464 KB total, pre-bundled, injected into the test browser at runtime. No version drift, no npm install surprises in consumer repos. The tradeoff: updating rrweb later requires re-vendoring the bundle manually. That's an acceptable cost; version conflicts across three consumer apps are not.
The integration model: rrweb runs in the browser during the test, capturing events continuously. When the test ends, the events are serialized to a temporary JSON file in /tmp; if the test failed, the recording is moved to the reports directory. When all tests complete, a report enhancer — ReportEnhancer.js, 581 lines — parses the WDIO HTML report, inserts a collapsible player section under each failed test row, and embeds the rrweb player with the recording inline. The final HTML file is completely self-contained.
Recording is configured to minimize overhead:
- Canvas disabled (
recordCanvas: false) — expensive and unnecessary for UI functional tests - Inputs masked (
maskAllInputs: true) — test data and credentials don't belong in replays - Full DOM snapshot every 30 seconds as a recovery checkpoint
- Events flushed to
/tmpevery 60 seconds as a safety buffer
Capturing network errors
Console capture was straightforward. rrweb's console plugin wraps console.log/info/warn/error with decorated functions that serialize arguments and emit them as rrweb events — all four levels, up to 10,000 characters per entry, in the same event stream as the DOM recording.
Network capture was not straightforward. The obvious approach — XHR/fetch interception — is fragile: it misses browser-initiated requests, doesn't capture low-level failures, and requires injecting code into the page under test.
The right tool is Chrome DevTools Protocol (CDP), which hooks into the browser's network layer directly, below the application. WDIO already uses CDP internally; the browser.cdp() API exposes it to test hooks. I subscribed to Network.responseReceived and captured error responses only — status ≥ 400. Successful requests aren't interesting for debugging, and capturing everything would bloat the recording. Full tracing would be noise; errors are signal.
The key design decision: instead of maintaining a separate network log, CDP errors are re-emitted as console.error calls in the browser context.
This sounds counterintuitive — why report a network error through the console? Because rrweb is already capturing the console. Re-emitting through console.error means network errors appear in the same event stream as the console logs, at the correct timestamp, without a separate UI component or data structure. In the replay, you see a console.warn from React, then a 404 from the API, then the console error that followed — all in sequence, all in context. One unified timeline instead of three separate panels.
How it integrates with WDIO
WDIO integrations come in two official forms: Reporter classes (which receive test lifecycle events and produce output) and Service classes (which hook into the browser lifecycle). CapVision uses neither. It exposes a hook factory:
const hooks = createWDIOCapVisionHooks(recorderConfig, enhancerConfig);

exports.config = {
  onPrepare: hooks.onPrepare,   // clear old recordings folder
  beforeTest: hooks.beforeTest, // init recorder, inject rrweb, set up CDP
  afterTest: hooks.afterTest,   // stop recording, save if failed
  onComplete: hooks.onComplete, // parse HTML report, inject player
};
Three lines of config change. One import. No class inheritance, no plugin registration, no understanding of WDIO internals required.
The Reporter and Service patterns are the "right" way to extend WDIO, but they require understanding the extension architecture before you can write anything. The hook factory is more flexible: hooks are already a first-class concept in WDIO, every wdio.conf.js already has them, and the integration is explicit — you can see exactly what fires at each lifecycle point without reading plugin documentation.
The report — what you actually see
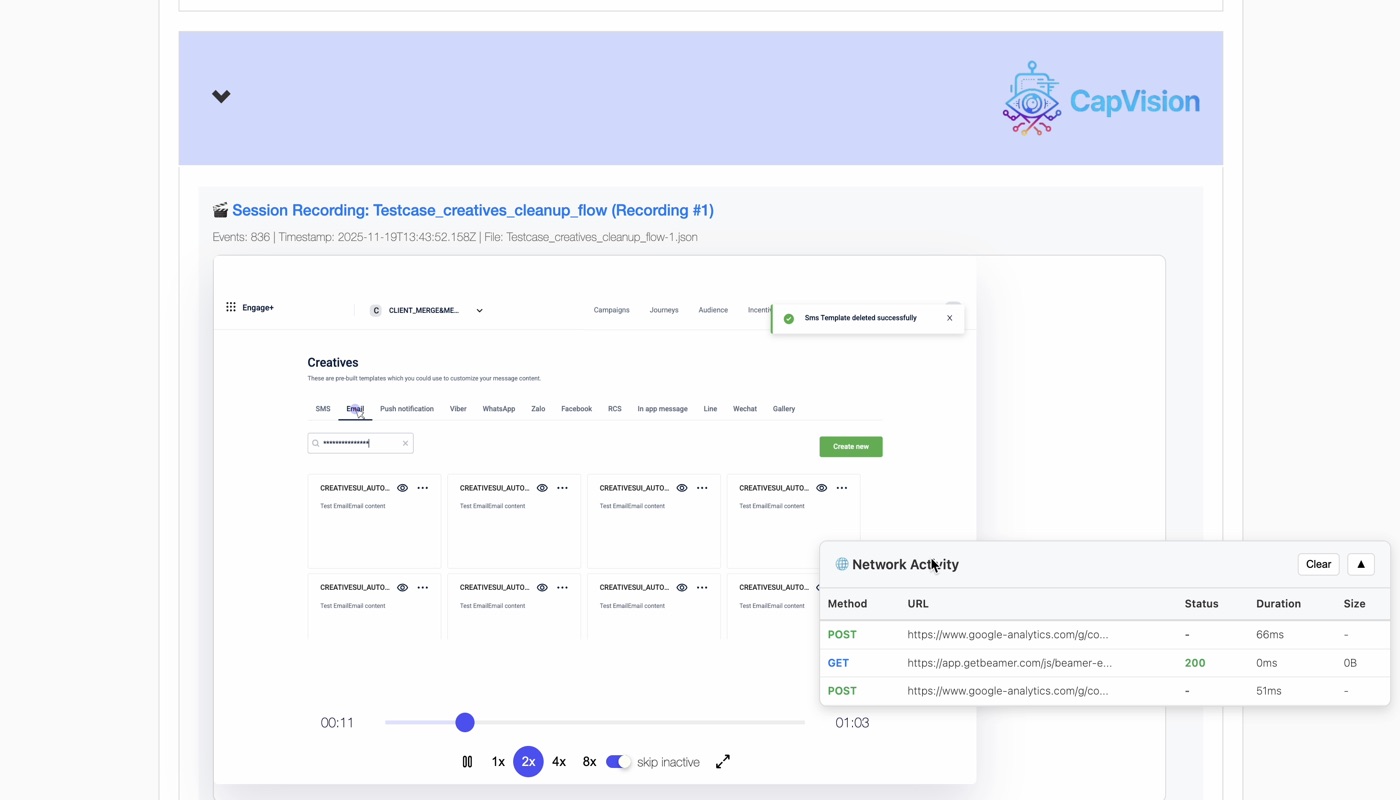
ReportEnhancer.js runs after the suite completes. It reads the generated HTML report, parses it, inserts a collapsible CapVision panel for each failed test — containing an embedded rrweb player with the full session — and writes the modified HTML back to disk. The output is a single self-contained HTML file: no external server, no CDN, no URLs that expire. Open it in any browser and the replay is there.
What the player shows:
- DOM reconstruction from serialized mutation events — not a pixel video
- Timeline scrubber with total event count and session duration
- Playback controls: pause, speed (1×/2×/4×/8×), Skip Inactive
- Mouse-trail overlay
- Console-log panel showing all captured output with timestamps
- Network Activity overlay showing HTTP errors with status codes and durations
One session recording captured 836 events over 63 seconds (01:03) — the full flow visible, including a toast notification mid-run and network activity at the exact moment of failure. You can pause at any point and see the exact DOM state at that timestamp. When a test asserts that an element should be visible, you can find the frame where it wasn't — and see what the console was saying at the same moment.
Console output and UI state are captured in the same session. The split view shows the Chrome DevTools console on the left — stack traces, API calls, field logs — alongside the DOM replay on the right, at the same timestamp.
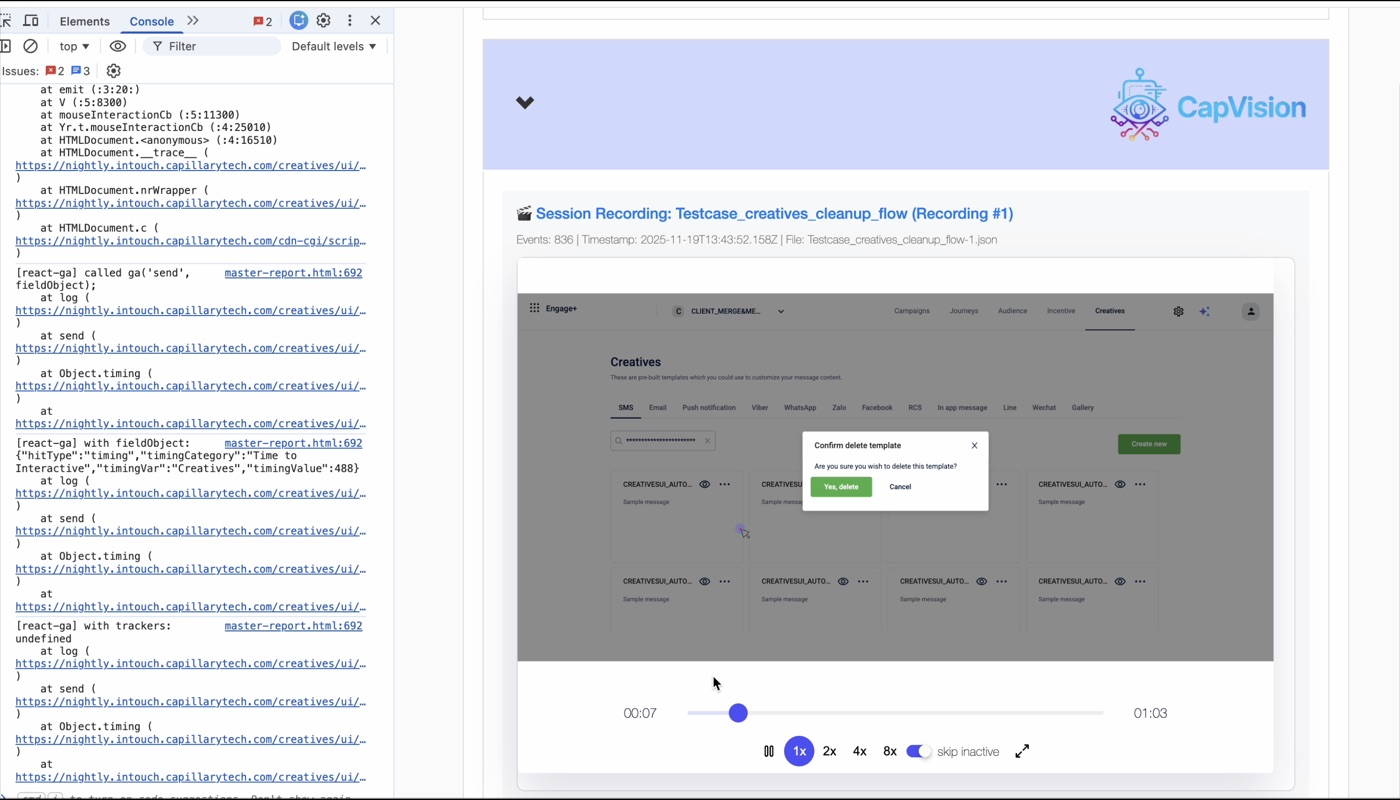
The unified timeline means you don't correlate logs with screenshots manually. The console event and the UI state it corresponds to are already in sync.

A note on "visual regression"
The CapVision README mentions a "visual regression mode." It has nothing to do with visual regression.
There is no pixel diff engine. No Percy integration. No screenshot comparison. No pixelmatch. "Visual regression mode" means saveAllRecordings: true — recordings are saved for passed tests too, not just failed ones, so engineers can manually audit UI behavior across a suite run and catch things that pass assertions but look wrong.
VISUAL_REGRESSION=true ENABLE_RECORDING=true npx wdio --suite visual-regression
The name is a product decision, not a technical one. It maps to a recognizable concept — "reviewing UI behavior across runs to catch what assertions miss" — even though the implementation is just a toggle, and arguably more useful than full pixel diffing for most real regression questions, because you see the full interaction, not a snapshot delta.
What we gave up — and what CapVision is not
Every constraint that made CapVision shippable in a day also drew a hard boundary around what it can do. Being explicit about that:
- DOM replay isn't video. rrweb reconstructs page state from serialized DOM events; it doesn't capture pixel output. Canvas elements aren't recorded (
recordCanvas: false). WebGL, video, and custom rendering contexts won't replay. For most application UI this doesn't matter; for canvas-heavy interfaces it's a real gap. - Network capture is errors-only. CDP sees everything, but we only record responses with status ≥ 400. If a failure is caused by a successful API call returning incorrect data, the network log won't show it — you'd have to look at the console output or add an explicit assertion. The ~5% of failures caused by incorrect 200 responses don't justify the noise of capturing every request, but it's a real limitation.
- Storage is local. Recordings are JSON files embedded inline in the HTML report. No cross-team sharing unless you send the file, no searchable history, no way to compare recordings across runs. Real gaps for long-term observability — but out of scope for what this is.
- It's not a replacement for well-written tests. A structurally wrong test will still fail for the wrong reason; a session recording doesn't fix that.
- "Visual regression" ≠ pixel diff. If a future engineer reads the feature name and expects screenshot comparison, they'll be confused. The name will need to change or be clarified as the tooling matures.
What it is: a debugging artifact that didn't exist before. That's a smaller claim than "UI automation observability platform" — but it's the honest one, and in practice it's enough.
What happened
v1.1.0 of @capillarytech/cap-ui-dev-tools shipped on November 12, 2025 with CapVision included. USCRM deployment followed — enabled on the USCRM cluster for live failure monitoring on nightly builds.
The numbers from the first weeks of operation:
- MTTR: 260 min → 20 min — a 93% reduction in mean time to resolution.
- Complex failure diagnosis: 3–5 days → 2–4 hours — failures that used to require escalation to senior engineers now resolve within a single session.
- Failed fix attempts: 40% → under 10% — fixes based on what the recording shows, not what engineers think probably happened.
- Session adoption: >80% of the team using session replay within weeks of deployment.
- 1,000+ sessions recorded per week at stable USCRM usage.
- Average debug session: under 15 minutes. Not four hours. Not two days. Fifteen minutes.
In December, CapVision was presented at the Monthly Engineering Metrics showcase as an engineering achievement. The projected annual savings: $1.67M, based on 930 engineering hours recovered per month.
The peer recognition quote: "addresses the debugging challenges the UI team has been experiencing." That quote is accurate. It also undersells it. What CapVision addresses is the structural assumption that failure diagnosis is an investigative task. With a session replay, it isn't. It's a review task. You watch what happened. You fix what you see.
The thing about unplanned work
CapVision wasn't in a sprint. There was no ticket. No stakeholder asked for it. No OKR referenced it. The PRD, the build, and the merge happened in the same day — not because it was easy (the CDP routing decision and the report-embedding approach both required real investigation), but because a scoped tool with a clear constraint (embed everything in the report) gives you a bounded problem, and bounded problems are solvable in a day when you're not negotiating scope.
The gap was visible if you were looking for it — every engineer who ran a failing CI test and had nothing to debug it with was experiencing it. But visible gaps don't automatically become work. They become background frustration that people learn to live with, work around, and stop expecting to be fixed. The $2.88M didn't show up in any one person's workload; it was distributed across dozens of engineers, no single instance expensive enough to force a decision. The aggregate is what made it worth solving.
What changed is the posture. Before, the implicit assumption was that flaky tests were a debugging cost you absorb — you run it again, reproduce it locally, figure it out. That treats observation as optional, something you do after the fact if you're motivated enough. Now observation is the starting point. When a test fails, the question isn't "can I reproduce this?" It's "what did the recording show?"
The two produce very different conversations when a test fails in CI at 2am and nobody wants to spin up a local environment to find out why. One ends with "I'll look at it tomorrow." The other ends with an answer.
The report that told you the test failed but not why is not an acceptable artifact for a mature automation suite. It's a starting point dressed up as a deliverable. CapVision is what a deliverable looks like: the failure, the recording, the console, the network trace, in one file, ready to open. Not linked. Not generated separately. There.
The test still fails. At least now you know why.