For months, the number we were showing brands was 84–89%.
The real number was 48–61%.
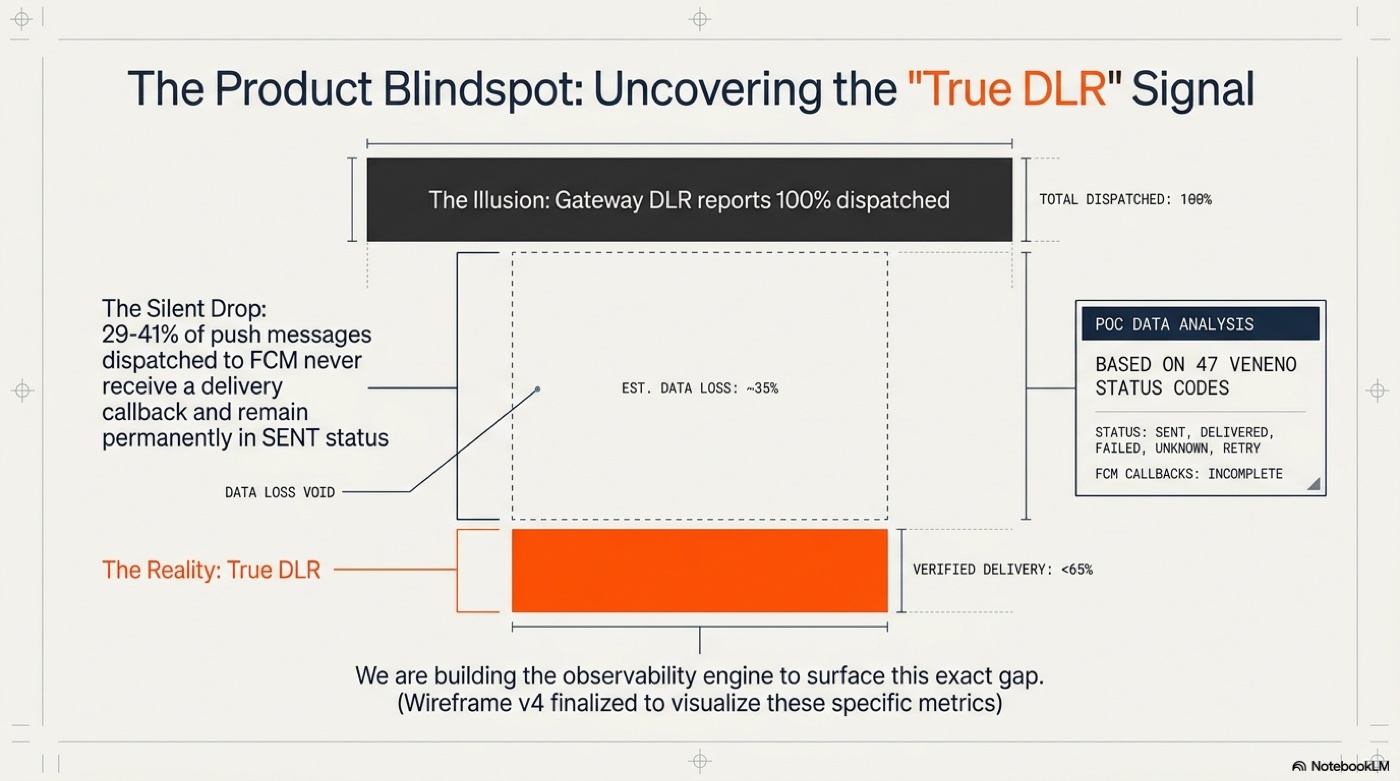
Both numbers were calculated from the same data. The difference was the formula. Gateway DLR — the number brands saw on their dashboards — is delivered / (delivered + failed). It excludes status code 7: SENT. A message that leaves the platform, hits FCM, gets accepted by the gateway, and then silently disappears with no callback, no error, and no delivery receipt is counted as neither delivered nor failed. It's excluded from the denominator entirely.
On our platform, 29–41% of every push notification ended up in that state.
That was the finding from a February 2026 RCA. That RCA is what triggered everything that followed.
What silent drop actually means
Status code 7 (SENT) is not a transient state. It's a terminal one. Once a message is in SENT with no subsequent callback, it stays there permanently. FCM accepted the message — the gateway reported success — but the device never received it.
The root cause, documented in the RCA by Abhay Gupta: an Android SDK initialization race condition. Android does not guarantee that Application.onCreate() completes before FirebaseMessagingService.onNewToken() fires. During cold-starts, onNewToken() can fire before the SDK is initialized. When that happens, the token is lost. But FCM doesn't know the token is stale — it continues accepting pushes to that token for up to 270 days. The gateway reports SENT. The notification is silently dropped. No DLR callback is ever generated.
This wasn't a rare edge case. It was happening to roughly one in three messages.
The formula hid it because the formula was designed for a world where SENT eventually resolved to DELIVERED or FAILED. In this world, it doesn't. A message that's been in SENT for 30 minutes isn't pending. It's gone. But nothing in the existing instrumentation named that.
That's the gap the observability platform exists to close.
The decision: don't just fix the bug, build the instrument
The SDK race condition could be fixed. Abhay was already working on it. But fixing the bug doesn't answer the questions that follow it: how many messages are currently in this state? Which gateways are affected? Which campaigns? Is it improving after the SDK fix ships?
Without an observability layer, those questions have no answers. You can fix the root cause and have no way to verify the fix actually worked at scale.
The observability platform was scoped specifically to make these questions answerable: True DLR — delivered / (delivered + failed + stuck_sent) — as a primary metric. Silent Drop Rate as a named, trackable KPI. Per-message trace timelines. Gateway health by provider. A brand-configurable alert engine.
The question was how to get there fast, on a codebase and infrastructure we didn't fully understand yet.
Before building the product, build the infrastructure to think about it
Four weeks of discovery. Seven sessions — six cross-team, one internal architecture review. Eight spec versions. A 1-day POC that changed the architecture. Thirty-four open questions at the start of April, two blocking ones at the start of May.
That kind of discovery, done the old way, is expensive. You attend sessions and take manual notes. You ask a question, get an answer, and file it in a doc somewhere. Six weeks later, a new engineer joins and you spend two hours re-explaining what the Veneno team said about the outbox proposal.
We approached this differently.
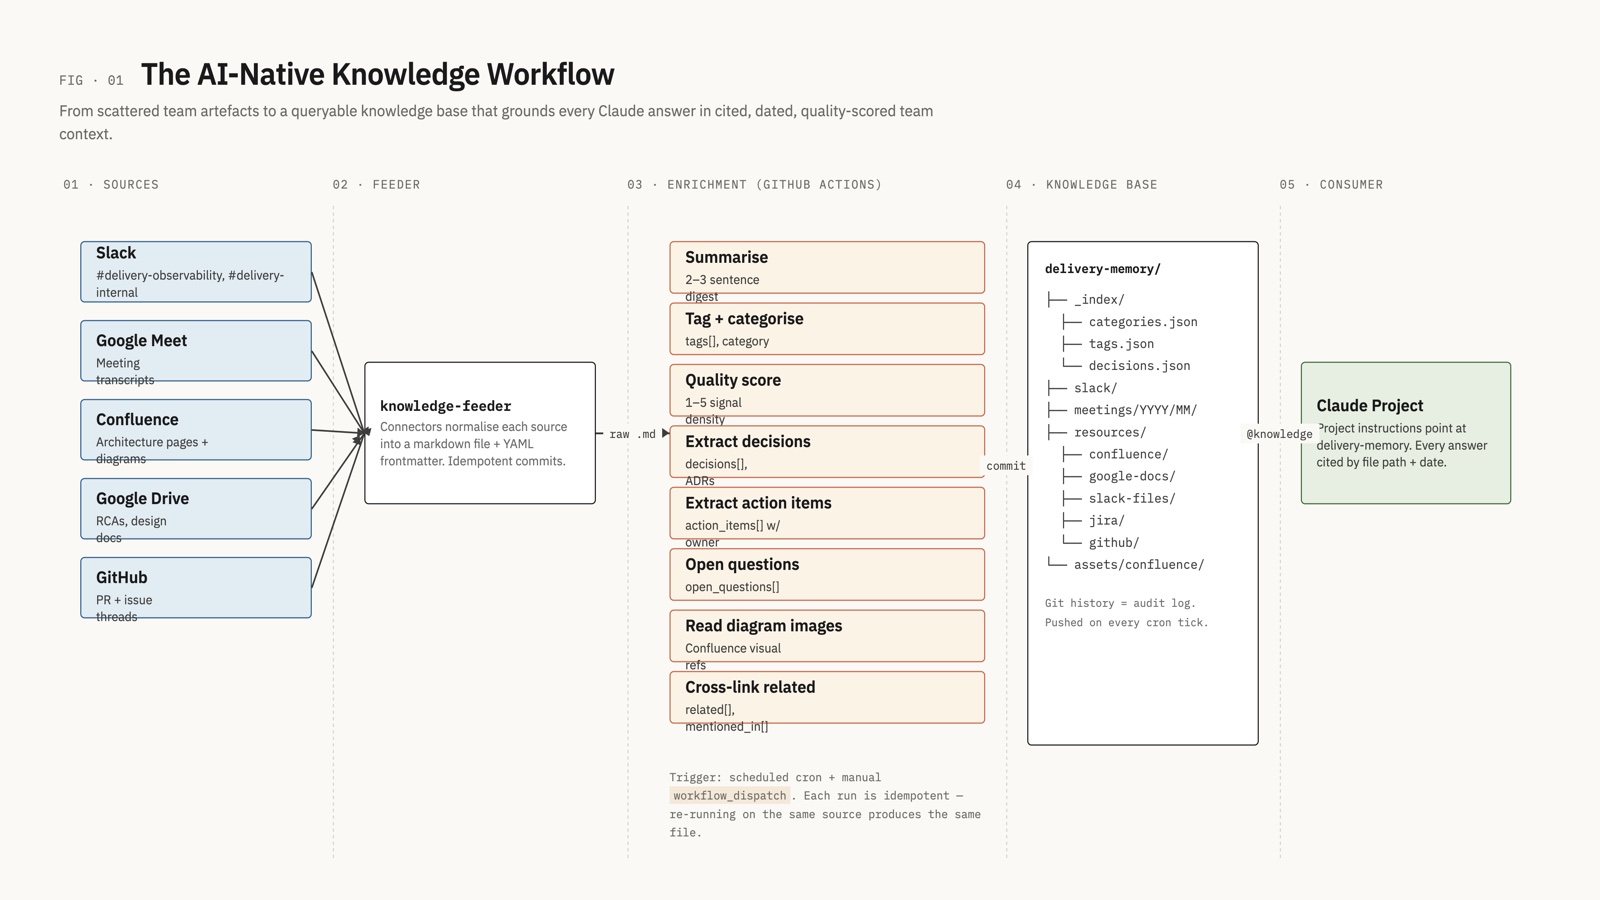
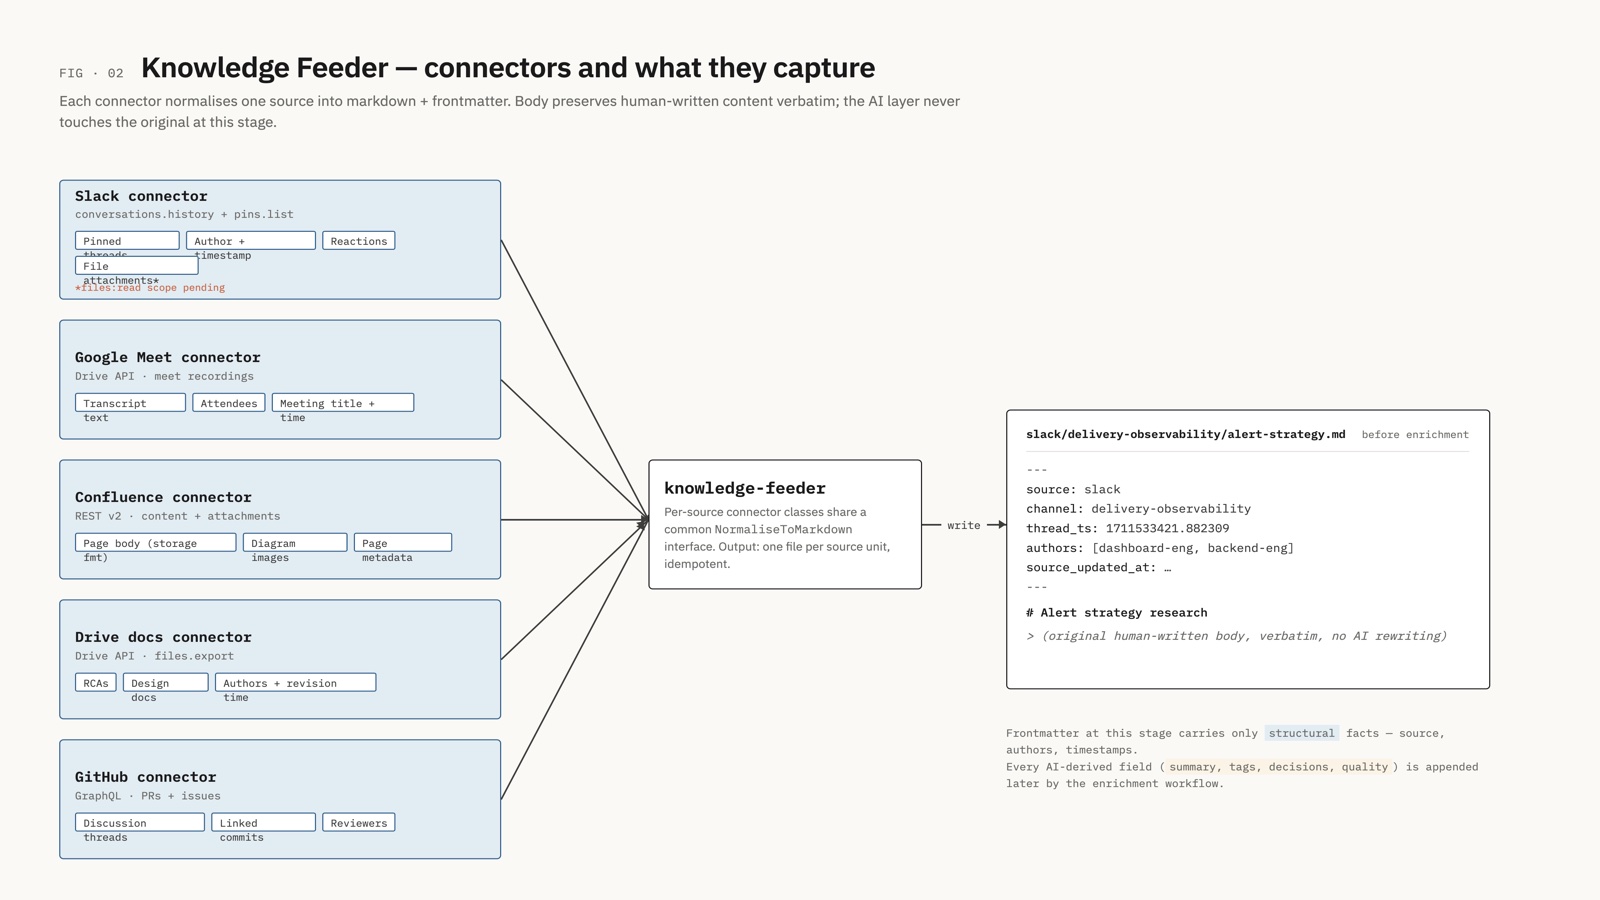
Before writing a line of production code — before the first spec section was drafted — we built a knowledge system for the project itself: a local CLI (knowledge-feeder) with five connectors — Slack, Google Meet, Confluence, Google Drive, and GitHub — that normalize each source into structured markdown and push to a version-controlled GitHub repository (dlr-memory). A GitHub Actions enrichment workflow then runs Claude against every new file, populating AI-derived metadata: summary, tags, category, decisions extracted, action items, quality score. The two stages are deliberately separate: the connectors write only structural facts (source, authors, timestamps); the AI layer never touches the original and only appends enrichment fields.
The mechanism:
- Any Slack message reacted with 📌 is automatically captured — full thread, resolved usernames, converted to markdown
- Every Google Meet transcript is fetched via the Drive API and parsed by speaker
- Confluence pages, Google Drive RCAs and design docs, and GitHub PRs and issues each have their own connector — every external reference that surfaces in a Slack thread is auto-fetched and added to the KB
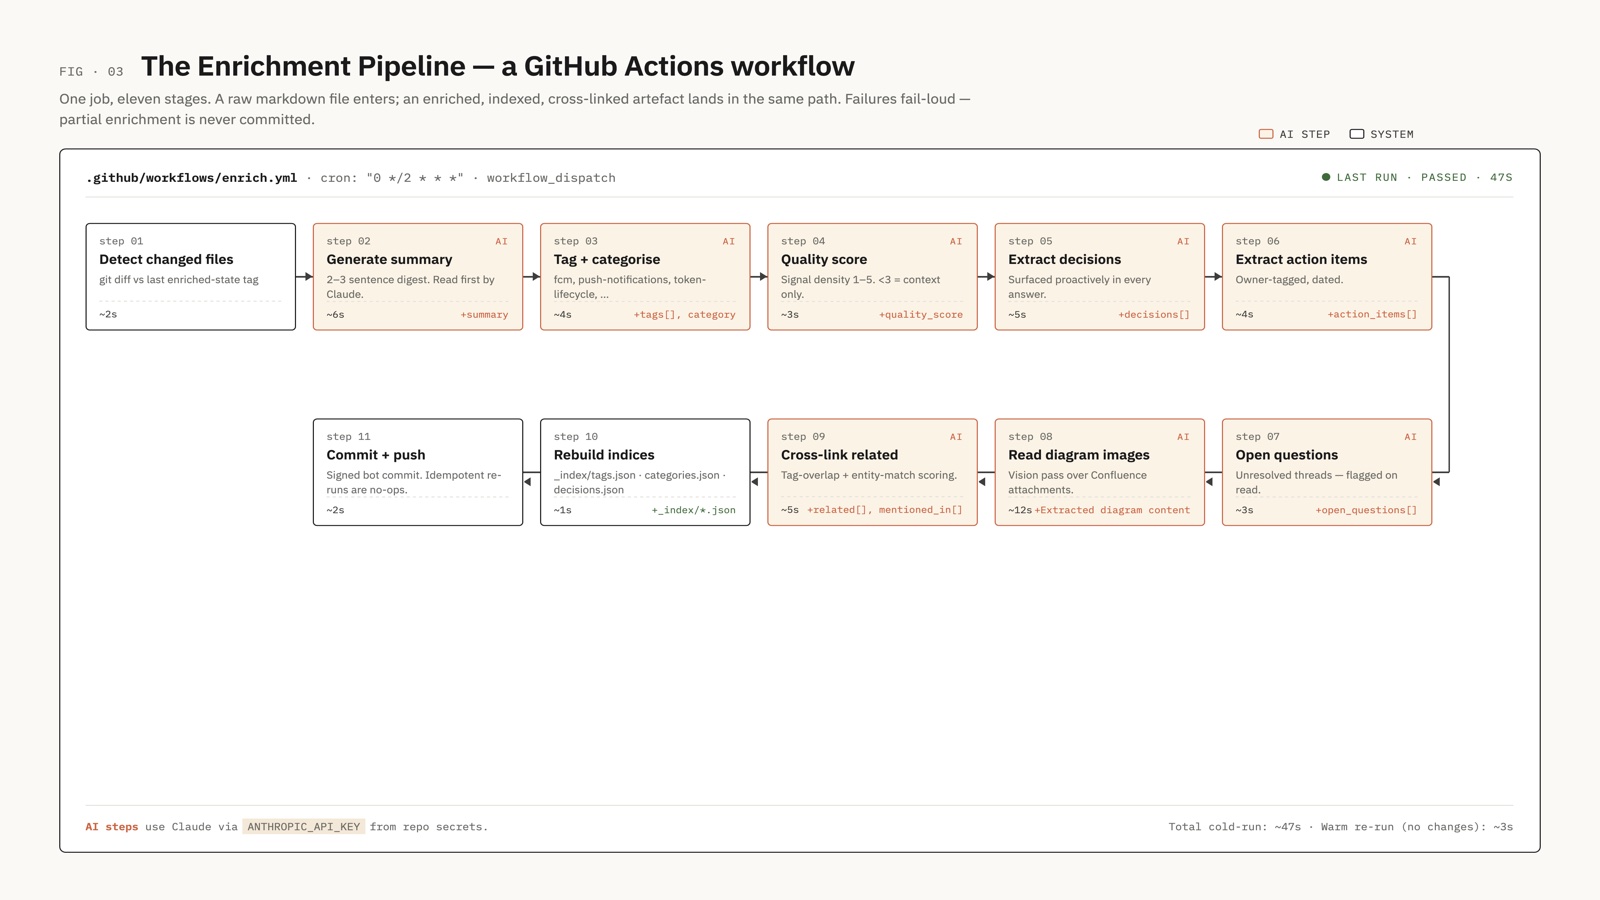
- On a two-hour cron cycle (or triggered manually via
workflow_dispatch), the enrichment workflow runs eleven Claude-assisted steps: generate summary, tag and categorise, score signal density, extract decisions, extract action items, flag open questions, run a vision pass over Confluence diagram images, cross-link related documents, rebuild index files (_index/decisions.json,_index/tags.json), commit and push. Cold run: ~47s. Warm re-run on no changes: ~3s. Failures fail-loud — partial enrichment is never committed.
The entire repo is loaded into a Claude Project. Any team member — PM, engineer, QA, engineering manager — can ask conversational questions without touching a terminal. "What did the Veneno team say about the outbox proposal?" "What are all the decisions we've made about the ingestion architecture?" "What open questions are still unresolved from Session 4?"
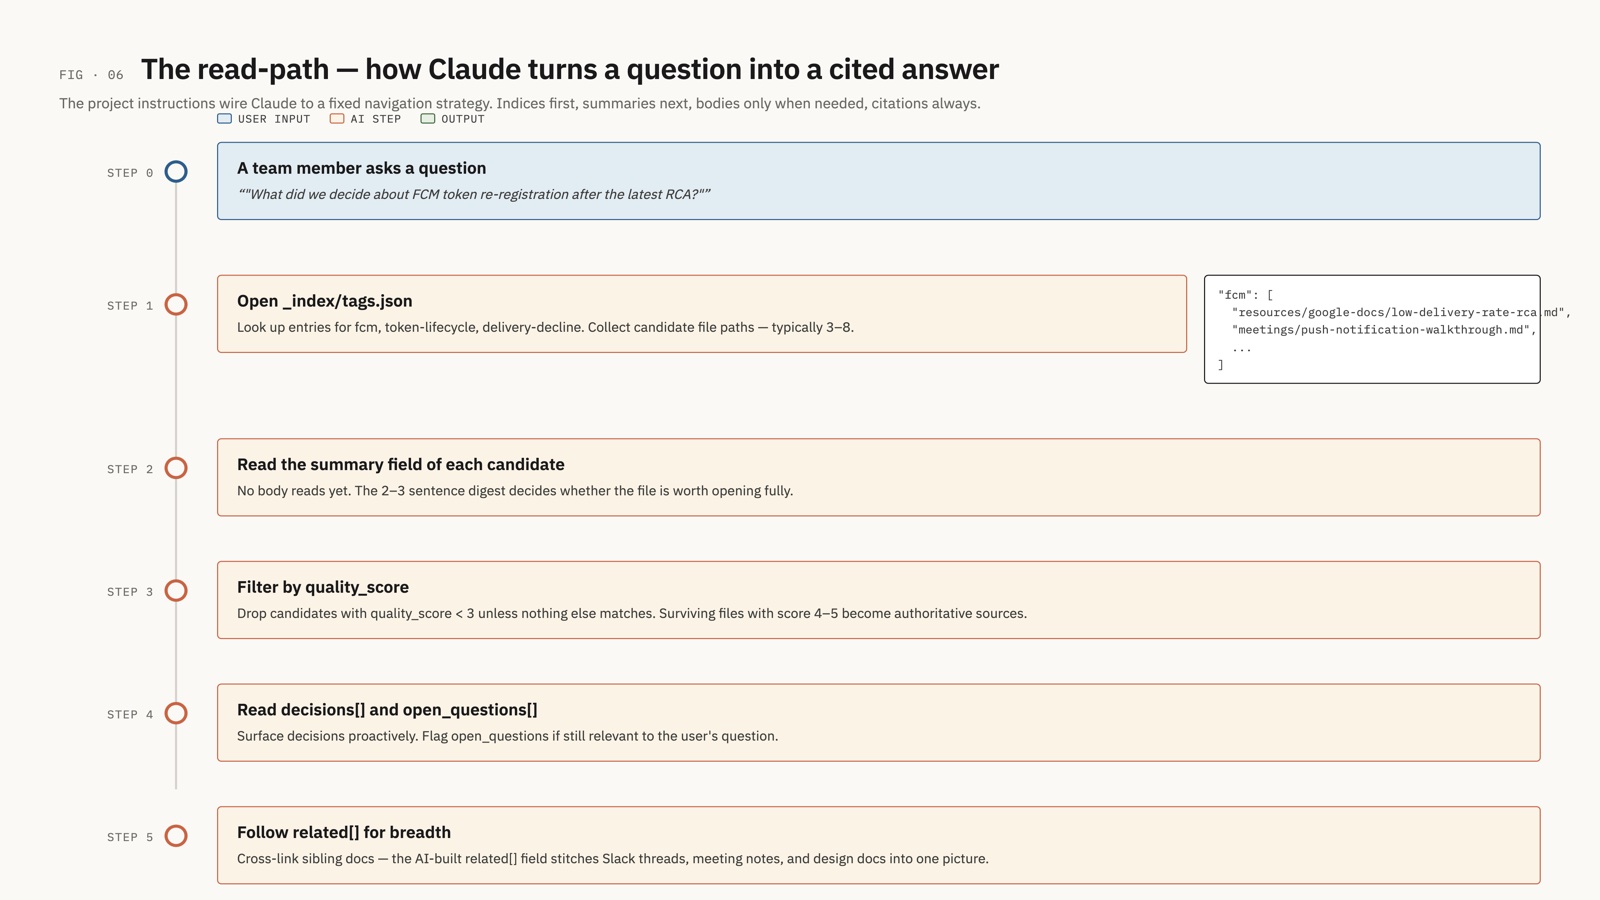
When I ran the direct database analysis on April 28, I didn't write up conclusions in isolation. I fed the query results into the KB, used Claude to reason about the data patterns, and wrote spec sections against a foundation that the whole team could verify. When Karan needed to write the Alert Use Cases section, he queried the KB for every product session decision instead of scrolling Slack history.
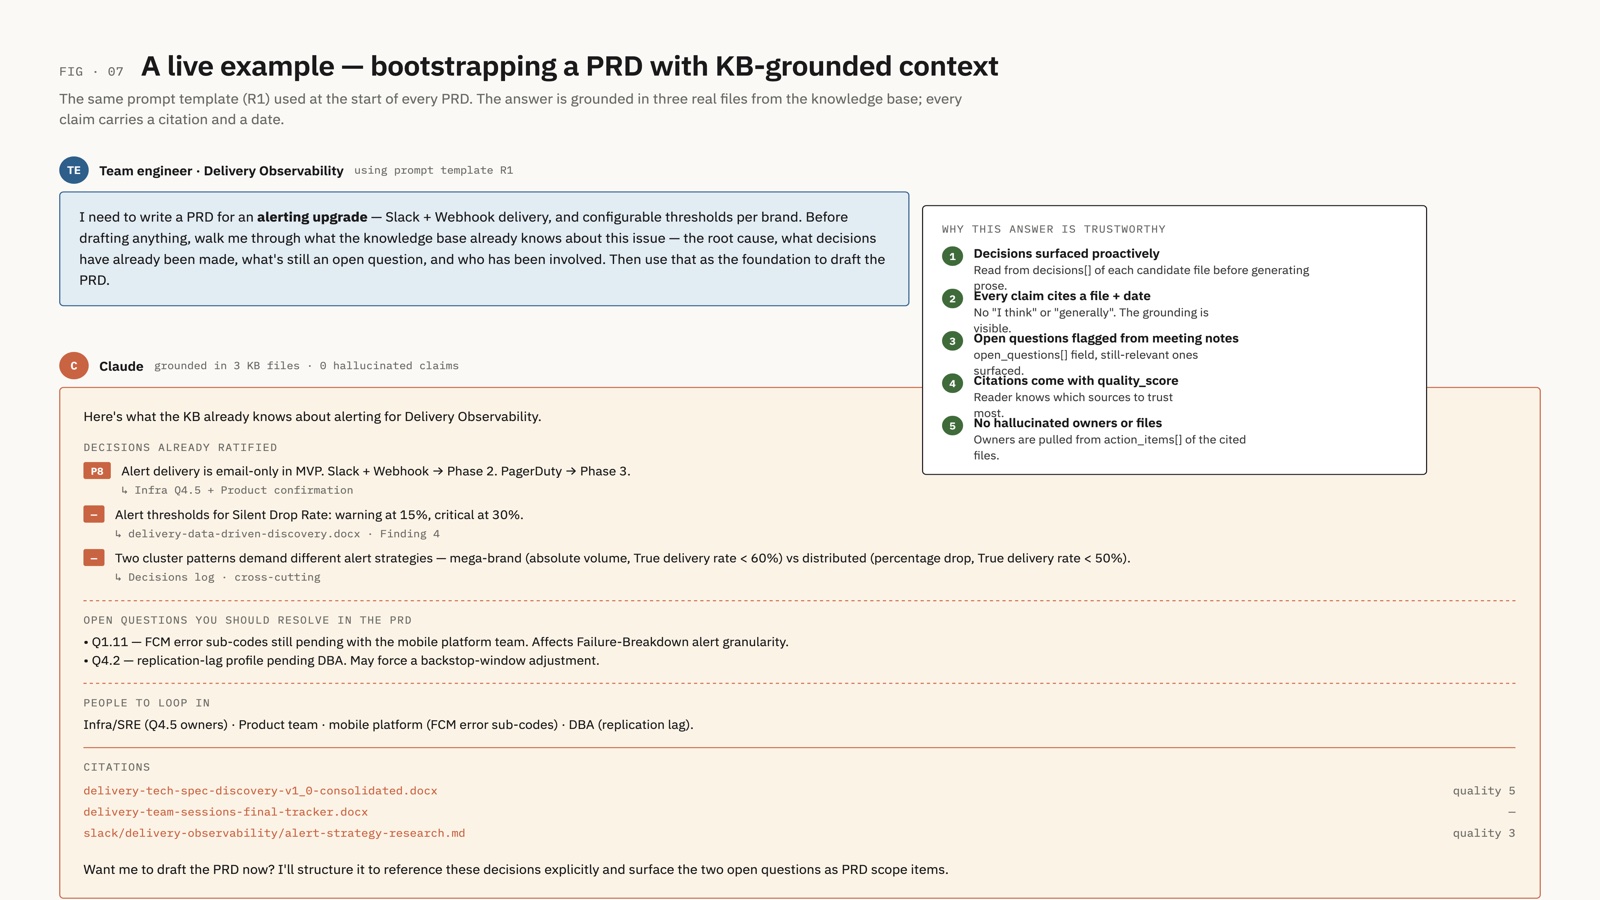
The 32 ADRs in the v1.0 spec — 25 ratified during discovery, 7 resolved and amended at Session 7 — weren't assembled from memory. They were extracted automatically from enriched meeting notes and session transcripts, cross-referenced, and validated against the decisions index.
Four weeks for a v1.0 spec covering seven layers, sixteen components, and a validated POC is not normal. The knowledge system is why it was possible.
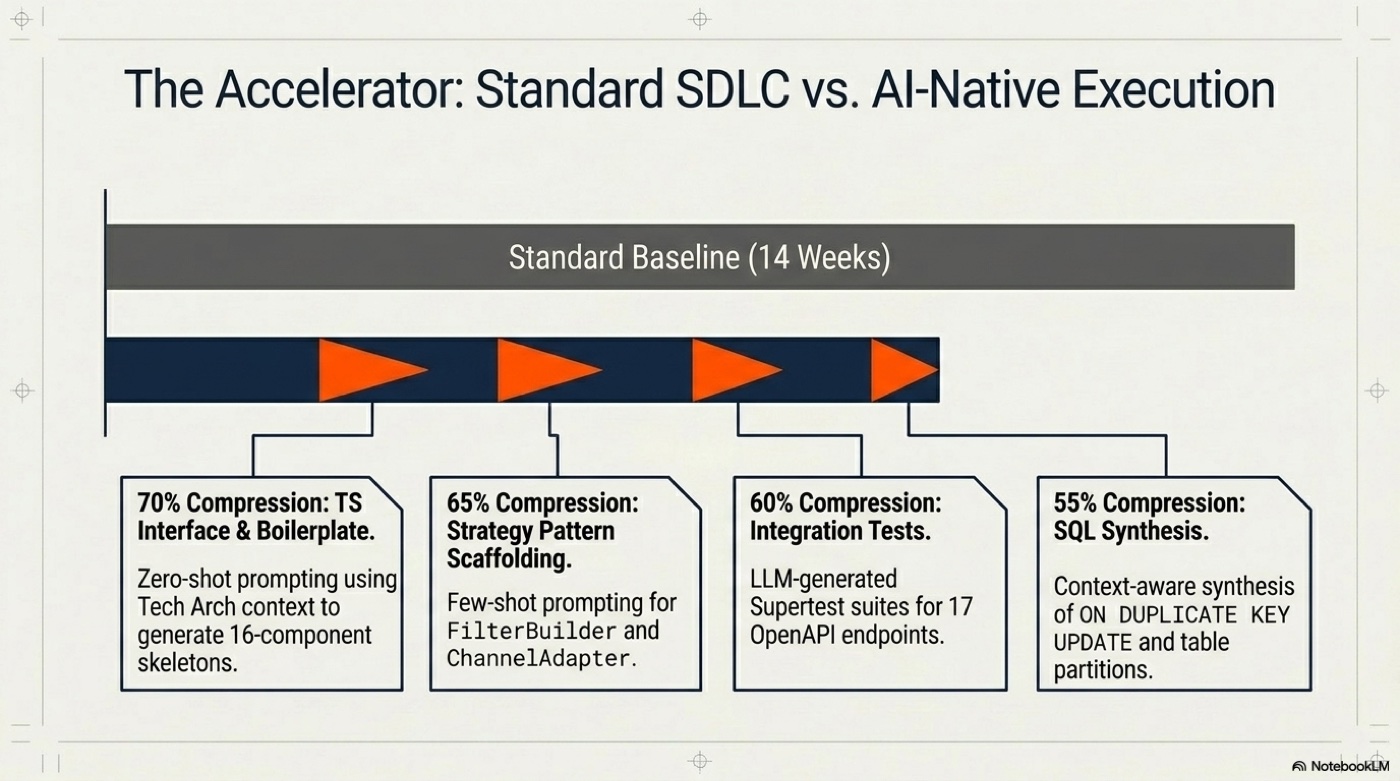
The compression doesn't stop at the spec. A standard 14-week SDLC from discovery kickoff to MVP puts the first production deployment in August. The AI-native execution plan targets end of May — 9 weeks total. Same scope, same seven layers, same 32 ADRs to implement. The implementation tooling is Claude Code: plan mode for every non-trivial component, spec-driven execution with every code file headed by its spec section reference, subagents for test generation and schema validation. The knowledge system built during discovery feeds directly into it — when an engineer reaches a component boundary and needs to understand a prior decision, they query the KB instead of reconstructing it from memory. That KB is now two weeks into powering implementation — the same artefact that compressed discovery is compressing execution.
What discovery actually looked like
Most technical discoveries happen in the wrong order: someone makes a decision, then goes looking for evidence that supports it. We tried to do it the other way.
April 28 — direct database analysis. Before deciding on the ingestion architecture, I ran queries directly against the nsadmin MySQL slave. Not against test data. Not against a staging replica. Against production, read-only, using the mysqlreader account already provisioned on every cluster.
What that analysis found:
- 47 status codes are documented in the Veneno schema. Seven are actually in use for push.
- The
auto_update_timecolumn has a dedicated BTREE index with cardinality 1.66M — the ingestion pattern I was designing would use this index exclusively. delivered_timehas systematic anomalies: Android bulk gateway shows a ~5.5-hour backward offset. iOS trans shows ~1.5-hour. These aren't random. They're gateway-specific and consistent.- Cross-month boundary is real: monthly partitioned tables (
messages_YYYY_MM), created on the 24th of the prior month. Late-arriving CLICKED and DELIVERED_VIA_PULL events can arrive several days into the next month.
None of this was in any internal documentation. All of it directly shaped the architecture.
Six external sessions — what each one killed or confirmed:
Session 1 (Veneno/Aman): killed the outbox proposal (10–50ms per-message overhead). Killed the RabbitMQ shadow consumer. Confirmed auto_update_time updates on every status change. Confirmed final-state-only row semantics — no transition log exists in the schema.
Session 2 (Product/Karan): confirmed dual DLR display (Gateway DLR alongside True DLR — not one replacing the other). Deferred the Analytics tab to Phase 2. Confirmed Silent Drop Rate as the fourth primary KPI.
Session 3 (Platform/Auth): confirmed the org RBAC layer already exists — integrate, don't build. Confirmed there's no platform audit service — build scoped within the observability service.
Session 4 (Infra/SRE): confirmed mysqlreader is already provisioned cluster-wide. Confirmed the storage budget: 25–30 GB per cluster. Confirmed email-only alerts in MVP.
Session 5 (CDP/Insight): confirmed reachability data exists in CDP, but is out of scope for MVP — SDK Health page deferred to Phase 2.
Session 6 (Frontend/CDB): confirmed there is no existing charting library in the frontend stack. We'd need to introduce one. Recharts was evaluated and chosen in the final ADR session.
Session 7 (Architecture/Internal): the final pre-implementation review. The five remaining open ADRs were closed. Two non-negotiable ADRs came out of it: ADR-31 locked the Global Filter architecture — FilterBuilder as the single translation point from filter params into SQL, Mongo, Redis cache key, and T-Digest key; ADR-32 locked multi-channel extensibility — org-scoped API paths (/orgs/{orgId}/delivery/*), a formal ChannelAdapter interface, non-push channels returning 501 Not Implemented in MVP. Both were marked non-negotiable in code review. The frontend spec was complete enough at this point that the wireframes shipped as a runnable React/Tailwind app — dlr-wireframes-v4.jsx, with mock data and five fully-rendered screens. Engineers could run it locally, click through the full product, and validate the API contracts before writing a line of production frontend code.
One near-miss: dbreader — the existing Java database abstraction layer — was the obvious candidate for database access. Three separate investigation rounds revealed it was completely unusable: (1) the service is Node.js, can't import Java; (2) MessageDao has no cross-org query method (3,645 lines, all per-org); (3) the @Query(SLAVE) annotation — the mechanism supposed to route reads to slaves — was dead code, useSlave hardcoded false. Even Java services on the platform were hitting the master. The observability service connects directly via mysql2, bypassing dbreader entirely.
May 6 — the POC that changed the architecture.
The ingestion design at v0.6 was a single streaming poller: watermark-driven, 60-second cadence, incrementally reading rows as auto_update_time advances. Clean, simple, observable.
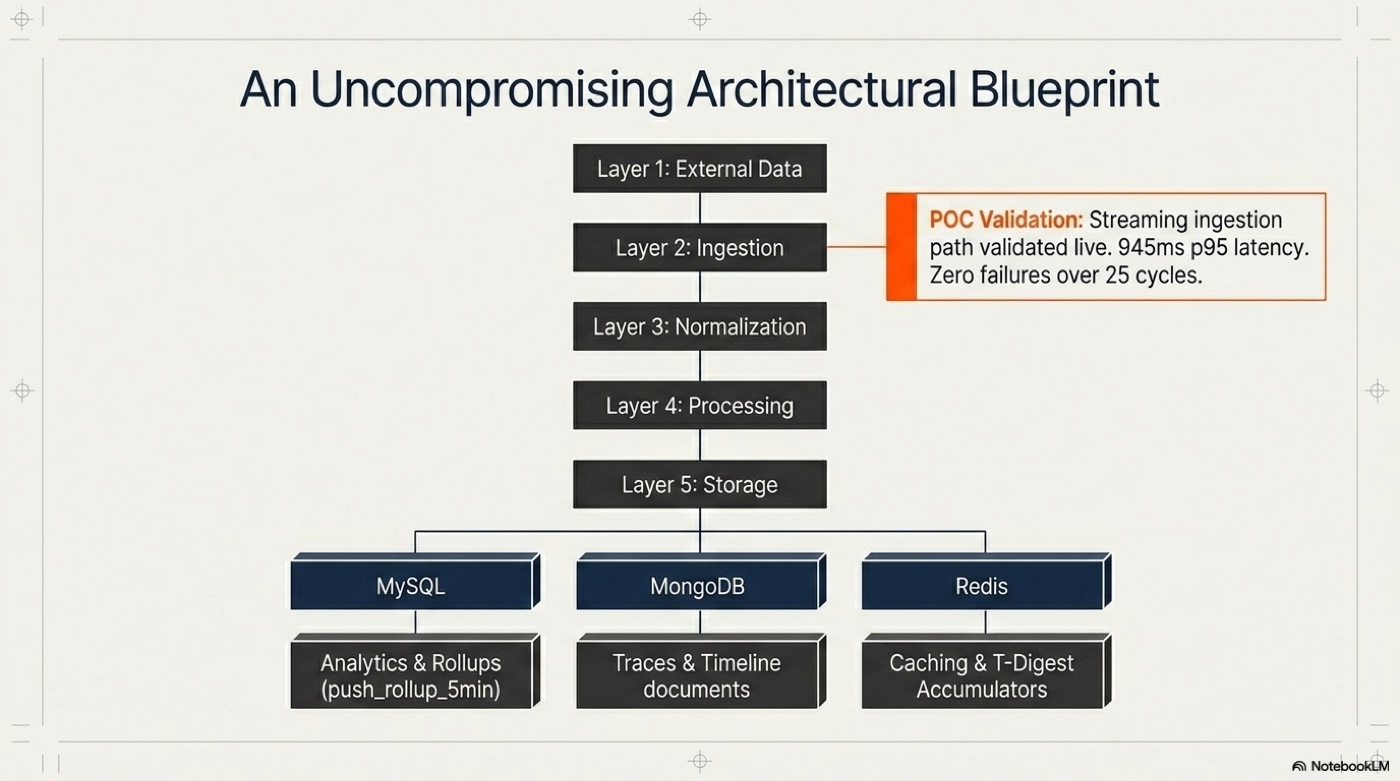
The POC ran for 24 minutes against production: 25 cycles, 20,211 rows ingested, p50 591ms, p95 945ms, 96.6% sub-second. Zero failures. The streaming approach worked exactly as designed.
Then I looked at the status code breakdown. Code 7 (SENT) rows in the stream: zero.
Out of 20,211 rows, in a cluster where ~29% of messages are in status 7, the stream returned none of them.
This is the core structural limitation of watermark-based polling: it observes the latest write to each row. A message that entered SENT on April 15 and hasn't been updated since has an auto_update_time from April 15. A stream starting today will never touch it. The watermark advances through current activity. The entire historical SENT population — the silent drop backlog — is invisible to it.
Silent drops are precisely the messages that never get updated. The streaming approach, by design, cannot see them.
This required a second ingestion path: the Backlog Poller. A separate 5-minute cadence job that queries with a GROUP BY instead of a watermark — counting stuck SENT messages per org that haven't updated in over 30 minutes (the settle window). It produces aggregate counts, not individual events, but it's the only way to surface the silent drop population without scanning 125M+ rows.
A new source field was added to the DeliveryEvent envelope — streaming or backlog — so the downstream pipeline knows which path produced each event and processes it accordingly.
The two-path design wasn't in the original spec. It came from the POC. This is why you run POCs before writing architecture documents — not after.
The architecture decisions that aren't obvious
Channel-agnostic from day one. The MVP is push-only. SMS, Email, WhatsApp, and RCS are Phase 2 and Phase 3. But the schema, the API contracts, and the UI classification logic are all designed without push-specific assumptions.
Adding SMS to the system costs approximately 200 lines of code and one config entry. The alternative — building push-native and extending later — costs a migration. We've seen enough migrations to know what that costs.
The message_class filter in the Streaming Poller (IN ('ANDROID', 'IOS')) is the one place push is hardcoded. Everything downstream processes a generic DeliveryEvent with a channel field.
MySQL over ClickHouse. The stack evaluation looked at ClickHouse and Databricks. Both are better suited for analytical workloads at scale. We chose MySQL for the MVP for one reason: every cluster already has a MySQL slave running with the mysqlreader account provisioned. ClickHouse would require new infrastructure on 15+ clusters. The per-cluster deployment model makes introducing a new dependency expensive in ways that don't show up in a technical evaluation.
The tradeoff is visible: MySQL with T-Digest for percentile approximation is a workaround for an analytical query engine running on a transactional database. It's not elegant. It's operational: zero new infrastructure dependencies in the MVP.
Node.js as the first non-Java service in this access pattern. The entire Veneno/comm-server stack is Java. Every service that touches nsadmin is Java. The observability service is Node.js.
The argument for Java was familiarity and consistency. The argument against it was time: the Node.js POC took one day to write and produced production-quality metrics. Setting up a Spring Boot service, connecting it to the mysql equivalent, bootstrapping the project conventions to match the existing Java services — four days minimum, based on how long equivalent Java service bootstrapping has taken on this platform. With an MVP target of end of May, that gap mattered.
The risk is real. The specific failure mode we're watching for: connection pool exhaustion under sustained polling load. The Streaming Poller runs every 60 seconds indefinitely — unlike a request-response server that spikes and idles, this service has a constant, predictable workload with no quiet periods. Under a Java connection pool this is well-understood; under mysql2 with pool.getConnection() the behavior under queue saturation is different. We've set a hard pool limit of 10 connections, configured a 30-second acquire timeout, and wired a pool utilization metric to the service health endpoint. If we hit sustained >80% pool utilization in production, that's the signal to revisit. The tradeoff is accepted, not dismissed — there's a difference.
Brand = Org hierarchy collapse. The initial design had a full RBAC layer: Brand > Sub-Brand > User with role-based access. Session 3 (Platform/Auth) confirmed that Org is already the top-level entity in the platform RBAC. Building a Brand abstraction on top of Org would introduce a new hierarchy layer with no existing infrastructure support.
Collapsing Brand = Org eliminated an entire RBAC tier, removed one database table, and simplified every API endpoint. What it cost: multi-brand views (where a user sees data across multiple sub-brands in one dashboard) are deferred to Phase 2. For the MVP, one session = one org. That's what brands actually need first.
What the system does
Seven layers. Sixteen components. The flow:
Ingestion: Two pollers (Streaming at 60s, Backlog at 5m) read from the nsadmin MySQL slave via the auto_update_time index. Watermark persisted in MySQL, mirrored to Redis. Cross-month UNION ALL for the first seven days of each month. The two-poller design wasn't the original plan — the POC proved that a single watermark-based poller structurally cannot see messages that stopped updating. One poller observes current activity. The other counts the stuck population. Neither can substitute for the other.
Processing: Events publish to a Redis stream. A classifier worker reads the stream, maps Veneno's seven active status codes to five UI buckets (Delivered, Engaged, Sent, Silently Dropped, Failed), enriches with campaign metadata from IRIS and gateway config from Veneno (both Redis-cached, 5-minute TTL). The five buckets are not Veneno's taxonomy — Veneno has no concept called "Silently Dropped." The classifier imposes a product-meaningful vocabulary onto raw status codes. That's intentional: brands shouldn't have to understand status code 7.
Storage: Two MongoDB collections per org. delivery_rollups — 1-minute pre-aggregated buckets with T-Digest sketches for latency percentiles, partitioned by channel, gateway, campaign. message_traces — one document per message, full lifecycle state, Loki query reference for raw provider logs. 30-day trace retention, 90-day rollup history. T-Digest is a workaround — percentile approximation on a transactional database is not what MySQL is for. The tradeoff is 5–10% approximation error on Latency P95 in exchange for zero new infrastructure dependencies across 15+ clusters.
Alert engine: Runs on every 60-second Streaming Poller cycle. Loads all active alert rules per org from MongoDB, evaluates current KPIs against thresholds (Gateway DLR, True DLR, Failure Rate, Silent Drop Rate, Latency P95), fires email notifications for breaches. Designed for 100 orgs × 50 rules max = 6,800 evaluations per minute. Alert evaluation is piggy-backed on the poller cycle rather than independently scheduled — alert latency is bounded at 60 seconds, which is the right tradeoff for a dashboard metric, not a real-time event stream.
API: 13 REST endpoints. The Global Filter (date range, channel, gateway, campaign) is a first-class concept implemented as query-time context — not stored state. Every endpoint accepts filter params and computes scoped aggregates from the rollup collection. Stateless filtering keeps the API simple and makes arbitrary filter combinations possible without schema changes; the 1-minute rollup granularity is sized specifically to keep query-time aggregation cost predictable under that pattern.
Frontend: React SPA with five screens: Overview (KPI cards + time-series), Gateway Health (four FCM gateways with DLR and trend), Campaign DLR (expandable per-campaign rows with message-level drill-down), Message Trace (full lifecycle timeline + raw Loki log expansion), Alert Rules (threshold wizard + active rules list). Recharts is the first charting library introduced to this frontend stack — Session 6 confirmed there was nothing. That's a dependency decision as much as a UI decision, and it was taken deliberately rather than inherited.
Observability (meta): Data quality indicators surface known anomalies directly in the dashboard — delivered_time backward offsets, replication lag (if detectable), cross-cluster confidence signals. We chose to expose these rather than silently correct them. Correcting them would hide upstream bugs. Showing them gives brands and internal teams an accurate picture of what the data actually says.
What changes when brands can see this
The before state: brands running campaigns on Engage+ see Gateway DLR (84–89%). They see campaigns completing. They have no signal on whether notifications reached devices.
The after state: brands see True DLR (48–61% on affected clusters). They see Silent Drop Rate as a named metric — not inferred, not estimated, tracked. They see per-gateway health broken out. They can set an alert to fire when True DLR drops below a threshold, so they know before a campaign completes that something is wrong.
The gap between what brands were seeing and what was actually happening — historically 25–40 percentage points — now has a name, a number, and an alert threshold.
That's not just a product improvement. It's correcting a measurement error that was baked into the platform for years. The Feb 2026 RCA is what surfaced it. The observability platform is what closes it.
The thing about building knowledge infrastructure first
We spent roughly the first week of discovery building the knowledge system before writing a single spec section.
That felt like overhead at the time. Four weeks is a short discovery window for a project of this scope — spending a week building tooling for the project rather than doing the project is a hard call to defend in a standup.
Here's what that week bought: every session produced structured decisions that were immediately queryable. Every database finding was instantly in the KB. When the POC changed the architecture on May 6, the finding was captured, enriched, and cross-linked to the spec sections it affected within minutes. When I wrote the v1.0 consolidation doc yesterday, I was assembling from a structured, searchable knowledge base — not from memory and Slack scrollback.
The 32 ADRs in the spec weren't assembled from memory. They were extracted from enriched session transcripts by the enrichment agent, indexed, and cross-referenced. I verified them, I didn't reconstruct them.
Four weeks, eight spec versions, seven sessions, a POC that required rearchitecting a core component — the knowledge system is the reason that timeline was possible. It's not where the time went. It's why the time that was spent was usable.
The product hasn't shipped yet. The MVP target is end of May. What we know today — about the two-path ingestion architecture, the silent drop settle window, the channel-agnostic schema, the dbreader dead-end, the delivered_time anomalies — is fully documented, queryable, and verified. Any engineer joining this project can ask the Claude Project a question and get an answer grounded in the actual discovery work, not a retelling of it.
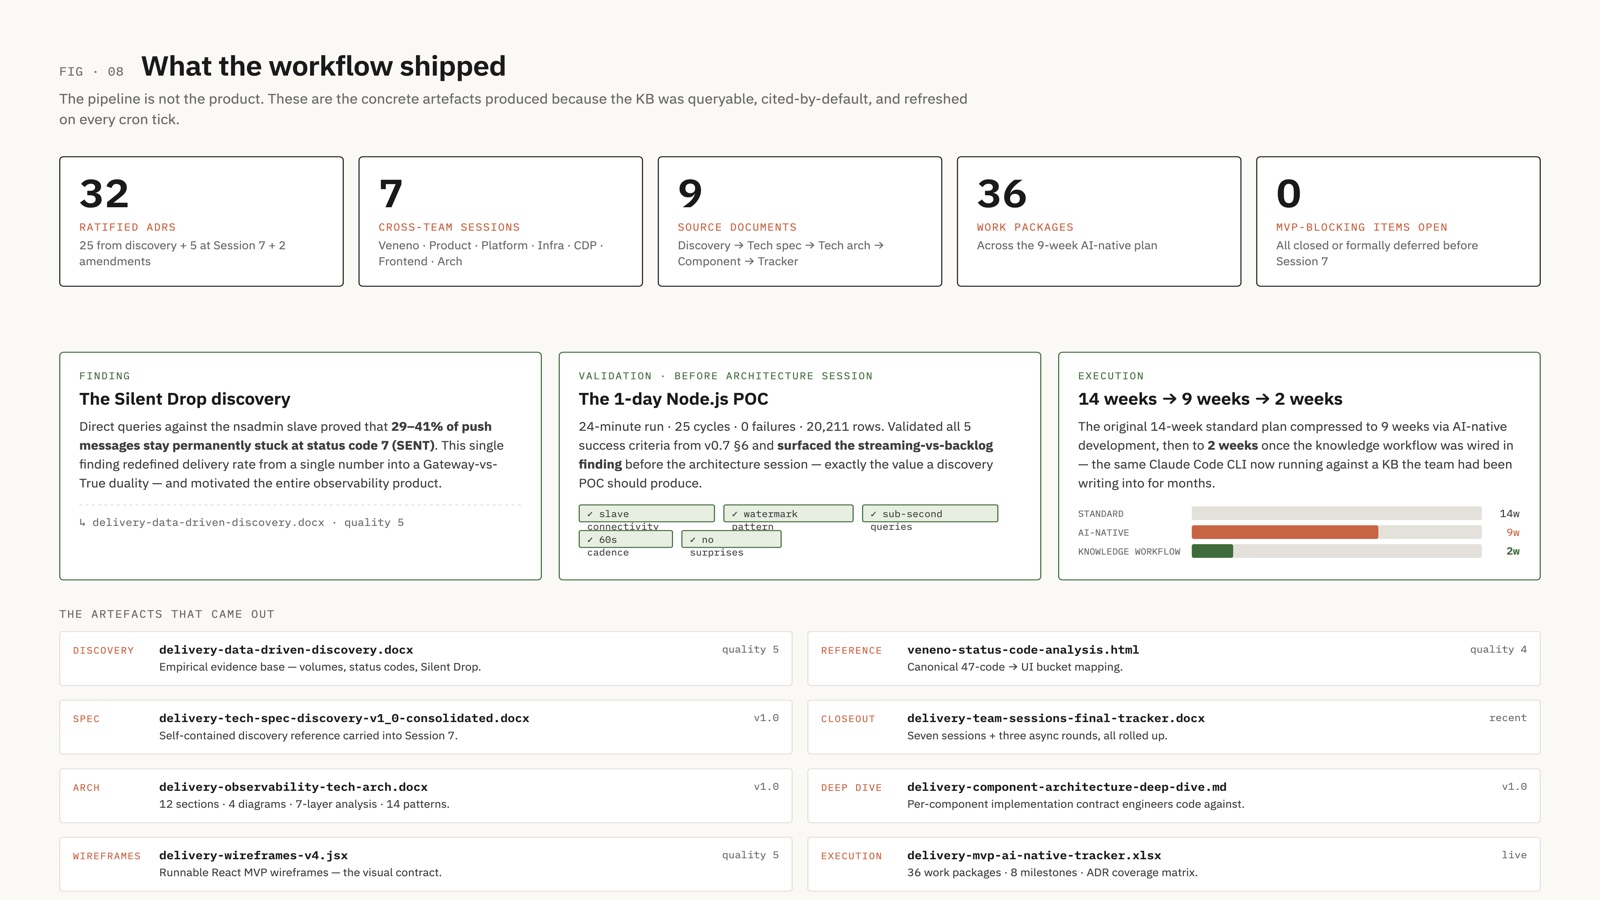
That's not a normal state to be in three weeks before an MVP ships.
The 30-point gap between what brands were seeing and what was actually happening wasn't a product bug. It was a measurement gap — a formula that excluded the failure mode it was most important to track.
Closing that gap required building an instrument that didn't exist. But getting the instrument right — getting to a validated architecture in four weeks rather than twelve — required building something else first: the infrastructure to think clearly about a complex, multi-team, data-intensive problem without losing the thread.
The DLR number was wrong because nobody had built the system to see it clearly. That's what we're building now. By end of May we'll know whether the architecture holds under real campaign load — whether the two-path ingestion catches what the POC said it would, whether the alert engine fires when it should, whether the True DLR number that lands on a brand's dashboard is one they can actually trust.
The spec is done. The work isn't.